
5. Monitoring with Canonical Observability Stack
The Canonical Observability Stack (COS) is a set of tools that facilitates gathering, processing, visualizing, and setting up alerts on telemetry signals generated by workloads in and outside of Juju. It is a universal monitoring solution that is designed for cluster administrators, allowing them to set up alerts and dashboards based on resource utilisation.
The Charmed Apache Spark solution comes with the spark-metrics exporter embedded in the Charmed Apache Spark OCI image which is used as a base image for driver and executor pods. The exporter is designed to push metrics to the Prometheus Pushgateway, which in turn is integrated with the Canonical Observability Stack.
To enable observability on Charmed Apache Spark, two steps are necessary:
- Deploy the COS (Canonical Observability Stack) bundle with Juju
- Configure the Apache Spark service account to use the Prometheus sink
Let’s start by creating a fresh Juju model with the name cos:
juju add-model cos
Now, deploy the cos-lite charm bundle:
juju deploy cos-lite --trust
When you deploy the cos-lite bundle, it deploys several charms like Prometheus, Grafana, Loki, etc. that together build up the Canonical Observability Stack.
Check the list of charms that have been deployed, their statuses, and relations:
juju status --relations --watch 1s
Wait until the status to be active for each charm:
Model  Controller  Cloud/Region        Version  SLA          Timestamp
cos    k8s         microk8s/localhost  3.1.7    unsupported  15:41:53+05:45

App           Version  Status  Scale  Charm             Channel  Rev  Address         Exposed  Message
alertmanager  0.25.0   active      1  alertmanager-k8s  stable    96  10.152.183.249  no
catalogue              active      1  catalogue-k8s     stable    33  10.152.183.165  no
grafana       9.2.1    active      1  grafana-k8s       stable    93  10.152.183.124  no
loki          2.7.4    active      1  loki-k8s          stable   105  10.152.183.145  no
prometheus    2.47.2   active      1  prometheus-k8s    stable   159  10.152.183.129  no
traefik       2.10.4   active      1  traefik-k8s       stable   166  192.168.10.120  no

Unit             Workload  Agent  Address       Ports  Message
alertmanager/0*  active    idle   10.1.139.112
catalogue/0*     active    idle   10.1.139.82
grafana/0*       active    idle   10.1.139.115
loki/0*          active    idle   10.1.139.110
prometheus/0*    active    idle   10.1.139.95
traefik/0*       active    idle   10.1.139.114

Integration provider                Requirer                     Interface              Type     Message
alertmanager:alerting               loki:alertmanager            alertmanager_dispatch  regular
alertmanager:alerting               prometheus:alertmanager      alertmanager_dispatch  regular
alertmanager:grafana-dashboard      grafana:grafana-dashboard    grafana_dashboard      regular
alertmanager:grafana-source         grafana:grafana-source       grafana_datasource     regular
alertmanager:replicas               alertmanager:replicas        alertmanager_replica   peer
alertmanager:self-metrics-endpoint  prometheus:metrics-endpoint  prometheus_scrape      regular
catalogue:catalogue                 alertmanager:catalogue       catalogue              regular
catalogue:catalogue                 grafana:catalogue            catalogue              regular
catalogue:catalogue                 prometheus:catalogue         catalogue              regular
catalogue:replicas                  catalogue:replicas           catalogue_replica      peer
grafana:grafana                     grafana:grafana              grafana_peers          peer
grafana:metrics-endpoint            prometheus:metrics-endpoint  prometheus_scrape      regular
grafana:replicas                    grafana:replicas             grafana_replicas       peer
loki:grafana-dashboard              grafana:grafana-dashboard    grafana_dashboard      regular
loki:grafana-source                 grafana:grafana-source       grafana_datasource     regular
loki:metrics-endpoint               prometheus:metrics-endpoint  prometheus_scrape      regular
loki:replicas                       loki:replicas                loki_replica           peer
prometheus:grafana-dashboard        grafana:grafana-dashboard    grafana_dashboard      regular
prometheus:grafana-source           grafana:grafana-source       grafana_datasource     regular
prometheus:prometheus-peers         prometheus:prometheus-peers  prometheus_peers       peer
traefik:ingress                     alertmanager:ingress         ingress                regular
traefik:ingress                     catalogue:ingress            ingress                regular
traefik:ingress-per-unit            loki:ingress                 ingress_per_unit       regular
traefik:ingress-per-unit            prometheus:ingress           ingress_per_unit       regular
traefik:metrics-endpoint            prometheus:metrics-endpoint  prometheus_scrape      regular
traefik:peers                       traefik:peers                traefik_peers          peer
traefik:traefik-route               grafana:ingress              traefik_route          regular
At this point, the COS has been deployed, but Charmed Apache Spark is not yet wired up to it. Generally, Prometheus collects metrics of services by regularly scraping dedicated endpoints.
However, Spark jobs can be ephemeral processes that may not last so long and are not really appropriate to be scraped. Moreover, the IPs/hostnames of pods are likely to change between runs, therefore requiring a more complex self-discoverable automation. For these reasons, we opted to have jobs run with Charmed Apache Spark push metrics (rather than having Prometheus pulling them) to a dedicated service, called Prometheus Pushgateway, which caches the metrics and exposes them to Prometheus for regular scraping, even when the Spark job has finished.
Therefore, to wire Spark jobs up with the observability stack, we need to deploy a Prometheus Pushgateway and then add Apache Spark configuration parameters to be able to connect to it. The Prometheus Pushgateway in turn will then be integrated with Prometheus.
Let’s deploy the prometheus-pushgateway-k8s charm and integrate it with the prometheus charm:
juju deploy prometheus-pushgateway-k8s --channel edge
juju integrate prometheus-pushgateway-k8s prometheus
Now, for Apache Spark to be able to access the Prometheus gateway, we need the gateway address and port. Let’s export them as environment variables so that they can be used later:
export PROMETHEUS_GATEWAY=$(juju status --format=json | jq -r '.applications."prometheus-pushgateway-k8s".address')

export PROMETHEUS_PORT=9091
Now that we have the Prometheus gateway IP address and port, let’s create a new service account in the cos namespace with all the configuration options that the spark service account in the spark namespace has, plus a few additional configuration options related to the Prometheus Pushgateway:
Get config from old service account and store in a file:
spark-client.service-account-registry get-config \
  --username spark --namespace spark > properties.conf
Create a new service account and load configurations from the file:
spark-client.service-account-registry create \
  --username spark --namespace cos \
  --properties-file properties.conf
Add configuration options related to Prometheus:
spark-client.service-account-registry add-config \
  --username spark --namespace cos \
      --conf spark.metrics.conf.driver.sink.prometheus.pushgateway-address=$PROMETHEUS_GATEWAY:$PROMETHEUS_PORT \
      --conf spark.metrics.conf.driver.sink.prometheus.class=org.apache.spark.banzaicloud.metrics.sink.PrometheusSink \
      --conf spark.metrics.conf.driver.sink.prometheus.enable-dropwizard-collector=true \
      --conf spark.metrics.conf.driver.sink.prometheus.period=5 \
      --conf spark.metrics.conf.driver.sink.prometheus.metrics-name-capture-regex='([a-z0-9]*_[a-z0-9]*_[a-z0-9]*_)(.+)' \
      --conf spark.metrics.conf.driver.sink.prometheus.metrics-name-replacement=\$2 \
      --conf spark.metrics.conf.executor.sink.prometheus.pushgateway-address=$PROMETHEUS_GATEWAY:$PROMETHEUS_PORT \
      --conf spark.metrics.conf.executor.sink.prometheus.class=org.apache.spark.banzaicloud.metrics.sink.PrometheusSink \
      --conf spark.metrics.conf.executor.sink.prometheus.enable-dropwizard-collector=true \
      --conf spark.metrics.conf.executor.sink.prometheus.period=5 \
      --conf spark.metrics.conf.executor.sink.prometheus.metrics-name-capture-regex='([a-z0-9]*_[a-z0-9]*_[a-z0-9]*_)(.+)' \
      --conf spark.metrics.conf.executor.sink.prometheus.metrics-name-replacement=\$2
Now that Prometheus is configured, let’s configure Grafana. For this tutorial, we are going to use a basic Grafana dashboard.
Deploy the cos-configuration-k8s charm for importing the grafana dashboard:
juju deploy cos-configuration-k8s \
  --config git_repo=https://github.com/canonical/charmed-spark-rock \
  --config git_branch=dashboard \
  --config git_depth=1 \
  --config grafana_dashboards_path=dashboards/prod/grafana/
Integrate the cos-configration-k8s charm to import the grafana dashboard:
juju integrate cos-configuration-k8s grafana
Once deployed and integrated, we can check the status of the juju model with the command juju status --relations, which should be similar to the following:
Model  Controller  Cloud/Region        Version  SLA          Timestamp
cos    k8s         microk8s/localhost  3.1.7    unsupported  17:44:56+05:45

App                         Version  Status  Scale  Charm                       Channel  Rev  Address         Exposed  Message
alertmanager                0.25.0   active      1  alertmanager-k8s            stable    96  10.152.183.249  no
catalogue                            active      1  catalogue-k8s               stable    33  10.152.183.165  no
cos-configuration-k8s       3.5.0    active      1  cos-configuration-k8s       stable    42  10.152.183.106  no
grafana                     9.2.1    active      1  grafana-k8s                 stable    93  10.152.183.124  no
loki                        2.7.4    active      1  loki-k8s                    stable   105  10.152.183.145  no
prometheus                  2.47.2   active      1  prometheus-k8s              stable   159  10.152.183.129  no
prometheus-pushgateway-k8s  1.6.2    active      1  prometheus-pushgateway-k8s  edge       7  10.152.183.36   no
traefik                     2.10.4   active      1  traefik-k8s                 stable   166  192.168.10.120  no

Unit                           Workload  Agent  Address       Ports  Message
alertmanager/0*                active    idle   10.1.139.74
catalogue/0*                   active    idle   10.1.139.100
cos-configuration-k8s/0*       active    idle   10.1.139.114
grafana/0*                     active    idle   10.1.139.85
loki/0*                        active    idle   10.1.139.106
prometheus-pushgateway-k8s/0*  active    idle   10.1.139.119
prometheus/0*                  active    idle   10.1.139.99
traefik/0*                     active    idle   10.1.139.84

Integration provider                          Requirer                                      Interface                  Type     Message
alertmanager:alerting                         loki:alertmanager                             alertmanager_dispatch      regular
alertmanager:alerting                         prometheus:alertmanager                       alertmanager_dispatch      regular
alertmanager:grafana-dashboard                grafana:grafana-dashboard                     grafana_dashboard          regular
alertmanager:grafana-source                   grafana:grafana-source                        grafana_datasource         regular
alertmanager:replicas                         alertmanager:replicas                         alertmanager_replica       peer
alertmanager:self-metrics-endpoint            prometheus:metrics-endpoint                   prometheus_scrape          regular
catalogue:catalogue                           alertmanager:catalogue                        catalogue                  regular
catalogue:catalogue                           grafana:catalogue                             catalogue                  regular
catalogue:catalogue                           prometheus:catalogue                          catalogue                  regular
catalogue:replicas                            catalogue:replicas                            catalogue_replica          peer
cos-configuration-k8s:grafana-dashboards      grafana:grafana-dashboard                     grafana_dashboard          regular
cos-configuration-k8s:replicas                cos-configuration-k8s:replicas                cos_configuration_replica  peer
grafana:grafana                               grafana:grafana                               grafana_peers              peer
grafana:metrics-endpoint                      prometheus:metrics-endpoint                   prometheus_scrape          regular
grafana:replicas                              grafana:replicas                              grafana_replicas           peer
loki:grafana-dashboard                        grafana:grafana-dashboard                     grafana_dashboard          regular
loki:grafana-source                           grafana:grafana-source                        grafana_datasource         regular
loki:metrics-endpoint                         prometheus:metrics-endpoint                   prometheus_scrape          regular
loki:replicas                                 loki:replicas                                 loki_replica               peer
prometheus-pushgateway-k8s:metrics-endpoint   prometheus:metrics-endpoint                   prometheus_scrape          regular
prometheus-pushgateway-k8s:pushgateway-peers  prometheus-pushgateway-k8s:pushgateway-peers  pushgateway_peers          peer
prometheus:grafana-dashboard                  grafana:grafana-dashboard                     grafana_dashboard          regular
prometheus:grafana-source                     grafana:grafana-source                        grafana_datasource         regular
prometheus:prometheus-peers                   prometheus:prometheus-peers                   prometheus_peers           peer
traefik:ingress                               alertmanager:ingress                          ingress                    regular
traefik:ingress                               catalogue:ingress                             ingress                    regular
traefik:ingress-per-unit                      loki:ingress                                  ingress_per_unit           regular
traefik:ingress-per-unit                      prometheus:ingress                            ingress_per_unit           regular
traefik:metrics-endpoint                      prometheus:metrics-endpoint                   prometheus_scrape          regular
traefik:peers                                 traefik:peers                                 traefik_peers              peer
traefik:traefik-route                         grafana:ingress                               traefik_route              regular
Now that we have the observability stack up and running, let’s run a simple Spark job so that the metric logs are pushed to the Prometheus gateway. For simplicity, we’re going to use the same count_ubuntu.py script that we prepared in the earlier steps of this tutorial:
spark-client.spark-submit \
    --username spark --namespace cos \
    --deploy-mode cluster \
    s3a://spark-tutorial/count_ubuntu.py
Once the job is completed, let’s try to open the Grafana web UI and see some metrics.
The credentials for the built-in admin user and the URL to the web UI can be retrieved using the get-admin-password action exposed by the grafana charm:
juju run grafana/leader get-admin-password
The resulted output should look like this:
admin-password: w5lk07PIW5U0
url: http://192.168.10.120/cos-grafana
Open the URL in a web browser.
Log in using admin as the username and the password that we just fetched in the earlier command.
We should see the Grafana web UI:
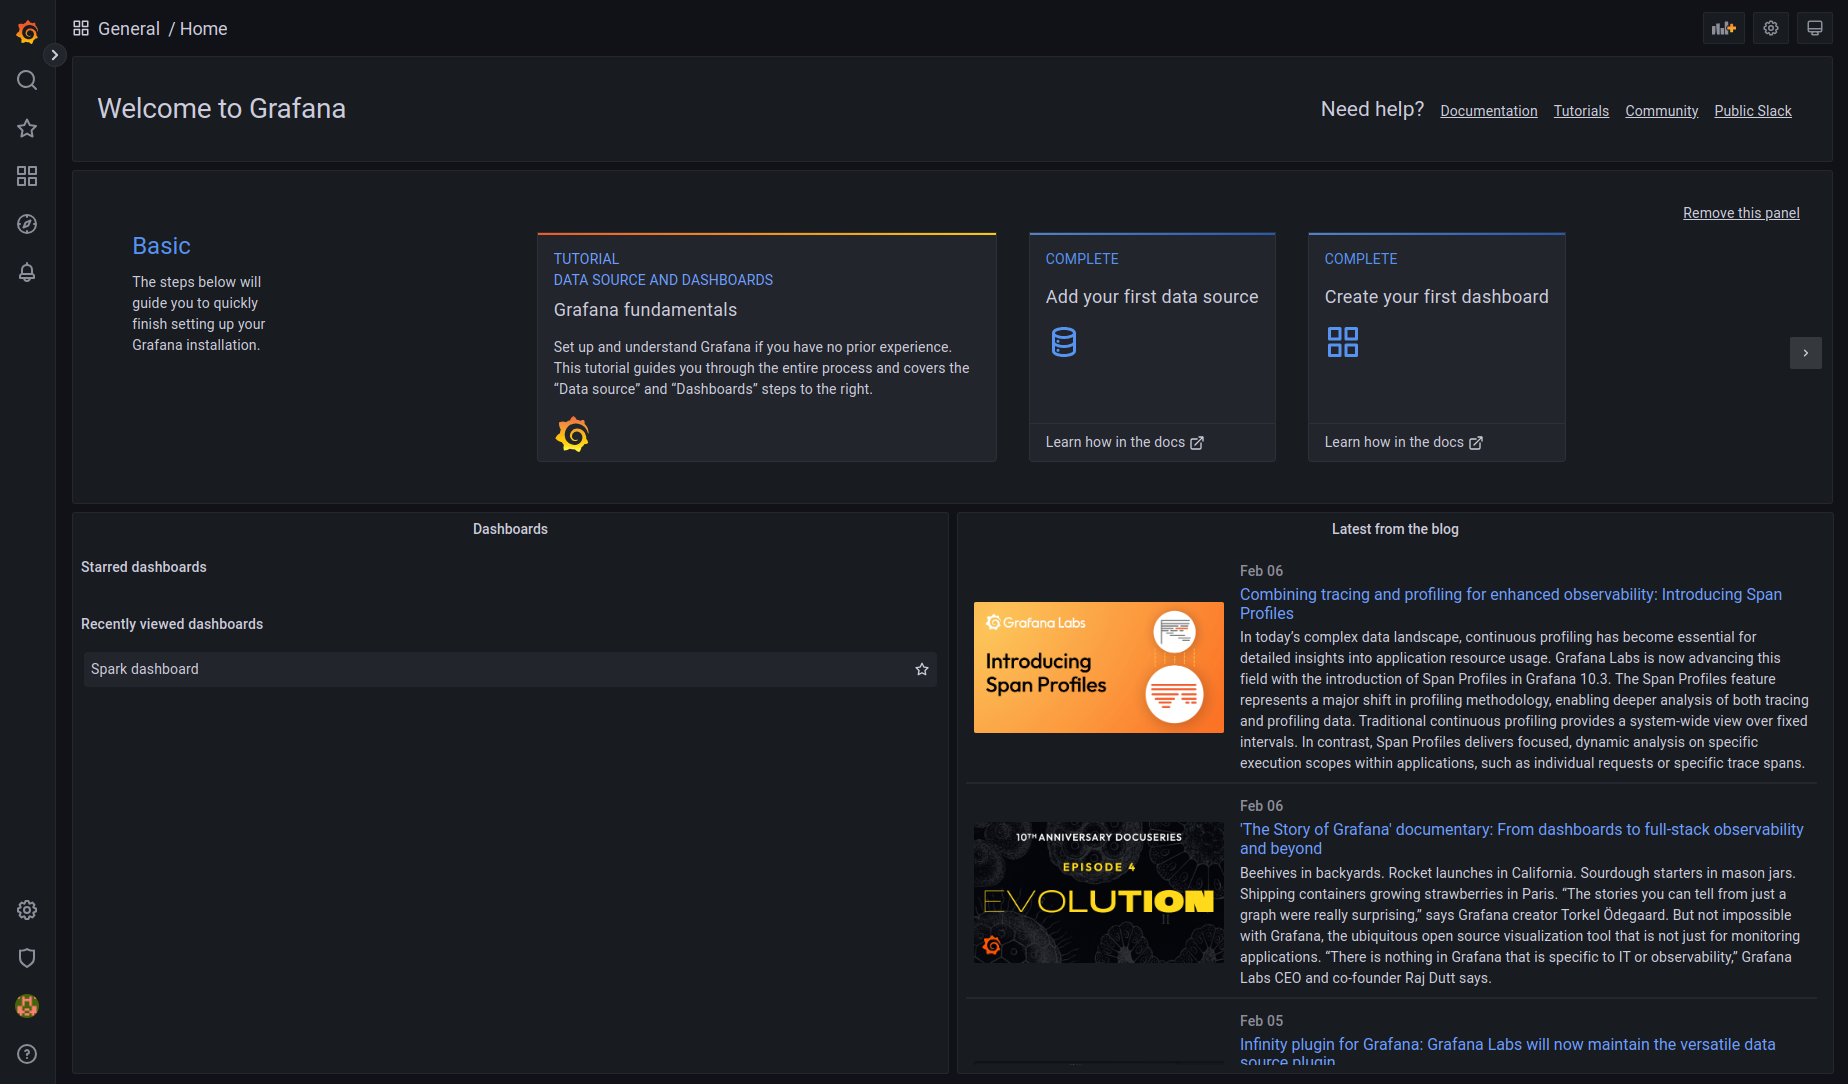
In the navigation menu on the left, select “Dashboards” and then “Browse”.
There you should see the “Spark Dashboard” listed.
This is the dashboard we configured earlier with cos-configuration-k8s charm:
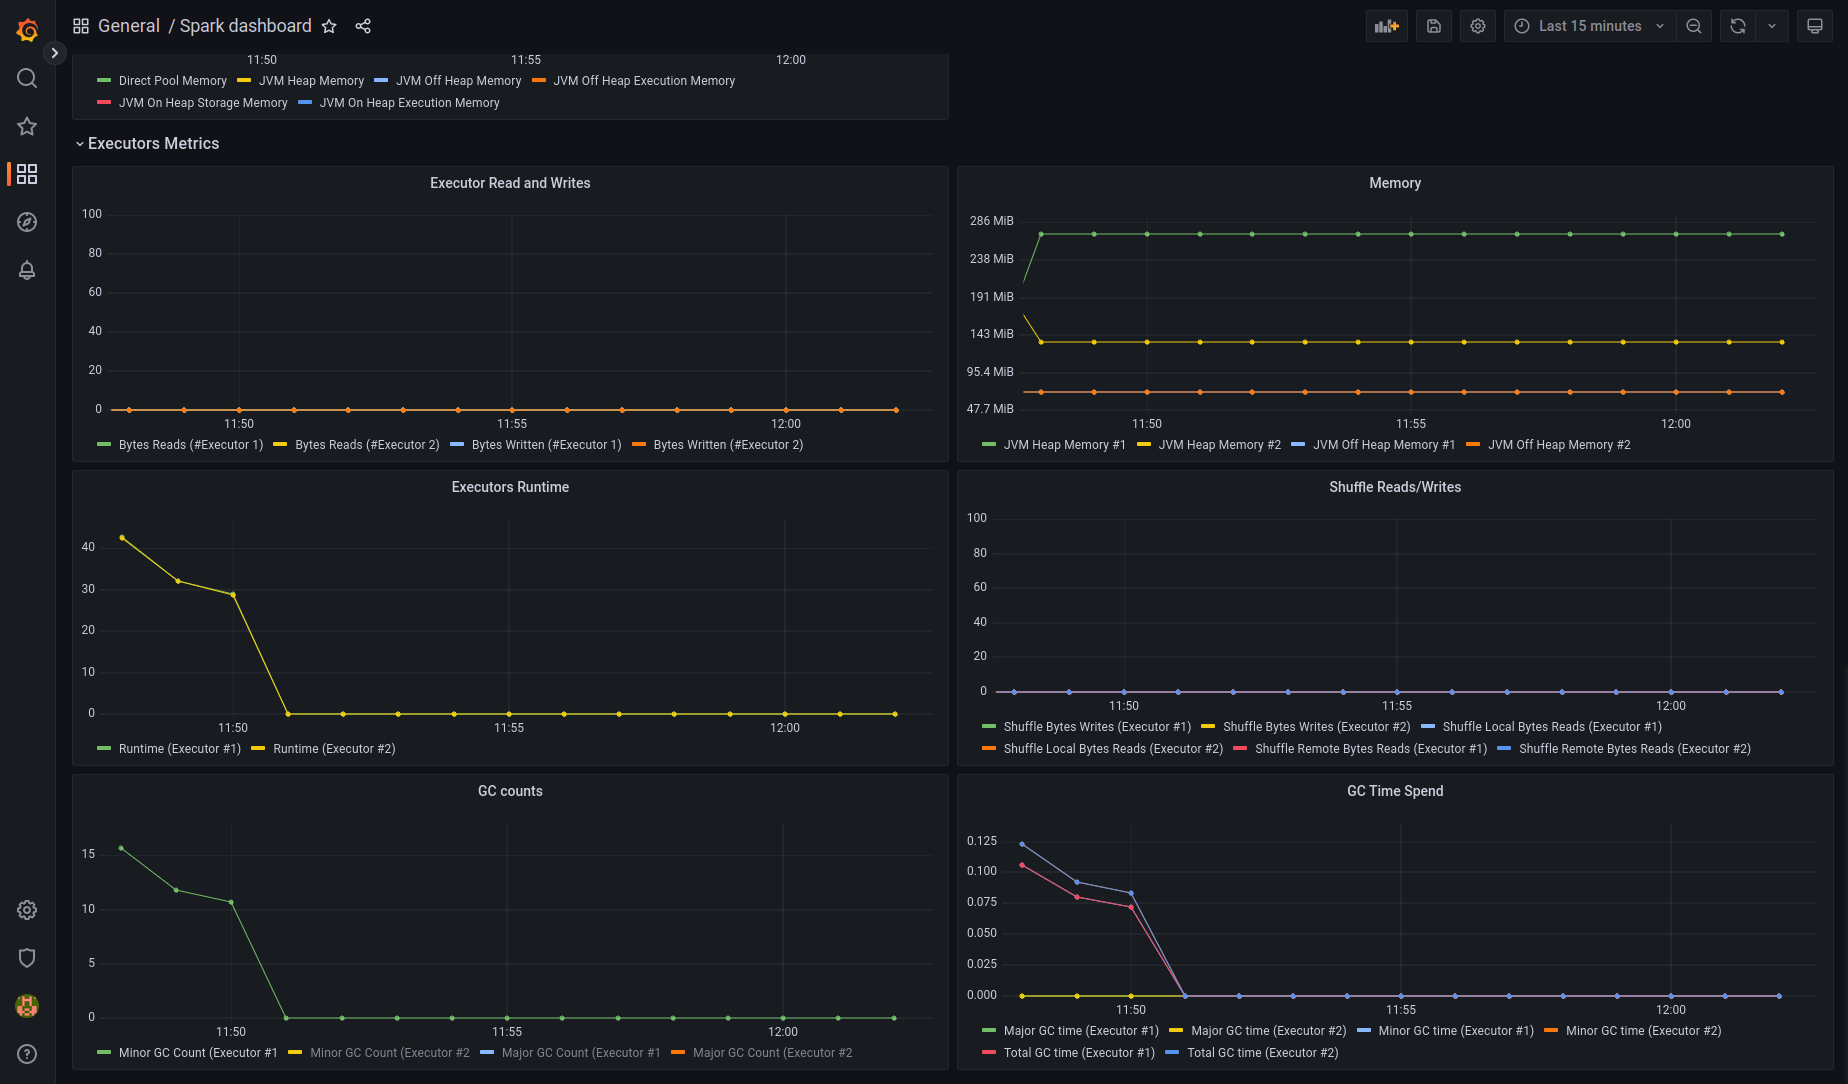
Play around the dashboard and observe the various metrics like Block Manager memory, JVM Executor Memory, etc.